
Hot Routes: An analysis of powerplay entry paths
Note: This article was originally submitted as a paper for the 2021 Big Data Cup. Many thanks to Stathletes and the Ottawa Hockey Analytics Conference for the data and opportunity.
Power plays provide a great opportunity for teams to create offense. The time and space afforded by the opponent having one less player on the ice allows the power play team to better control the puck and work towards high-danger scoring opportunities. This is assuming, of course, that the team on the advantage can establish possession in the offensive zone. These entry attempts are some of the more regularly “drawn-up” plays in hockey, making them an interesting candidate for a route recognition model, similar to what Next Gen Stats has been able to create for wide receiver routes with NFL tracking data.1 This paper uses event-level data from the NWHL, NCAA, and 2018 Women’s Hockey Olympic Tournament to determine the most common entry routes and makes the argument that more complex routes do not result in better offensive opportunities. The key takeaway from this analysis is that teams should “take what the defense is giving them” and follow the path of least resistance to the offensive zone.
Data
The data for this analysis is made up of 225 5v4 power plays from 28 games. Within these power plays are 840 unique possessions for the team on the advantage, defined to begin when a team:
- Wins the initial faceoff
- Regains possession outside of the offensive zone
- Recovers a turnover in the offensive zone when they hadn’t previously possessed it in the zone
- Has possession as a 5v3 penalty expires
and end when:
- They commit a turnover before entry
- The opponent successfully clears the puck after entry
These possessions can be divided into those beginning in the offensive zone and the three entry types (both successful and not): carried, dumped, and passed/played-in. The table below shows the frequency, entry success rate, and average number of corsi for, high-danger attempts,2 and successful passes per offensive zone trip for each group. The most obvious (though not revolutionary) takeaway from this data is that it is good to keep the puck in the offensive zone. Teams that begin a possession in zone have the highest average offensive output, indicating they spend more time in the offensive zone and are able to convert that into quality chances. The difference becomes even more stark when the conditional probability of entering the zone for the other possession types is considered. Looking past this to the other entry types, we see that most teams are trying to carry the puck into the zone. A caveat to this is that some of the failed attempts may have come from turnovers before the team could execute its planned dump-and-chase or pass to someone streaking across the line. While this explains some of the gulf in the success between carries and dump-ins, it still appears that teams could benefit from dumping the puck in more. The entry success rate is higher and the offensive production is not significantly different. Playing the puck in is similarly successful in a small sample, though the risk of an offsides whistle may limit its viability as a dominant strategy.
| N | Success % | Corsi | High-Danger | Passes | |
|---|---|---|---|---|---|
| In Zone | 194 | 100% | 1.33 | 0.54 | 5.18 |
| Carry-In | 502 | 65% | 1.21 | 0.49 | 3.54 |
| Dump-In | 100 | 84% | 0.99 | 0.51 | 2.79 |
| Play-In | 44 | 80% | 0.8 | 0.54 | 3.66 |
Methodology
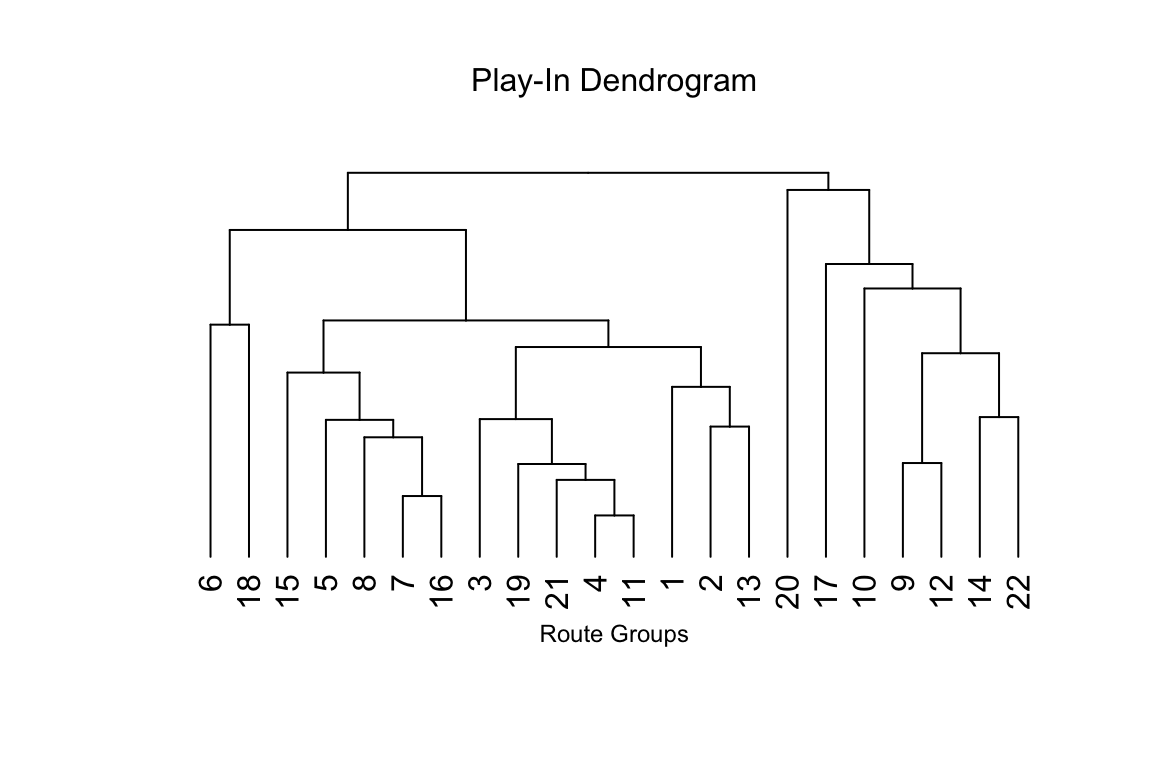
We can further our understanding of how entries impact powerplay offense by looking at not just how teams are entering the zone but also the path they take to get there. To do so, I separated the data by entry type and calculated the distance between each rush path, using Dynamic Time Warping to account for possessions of different lengths. These distances were then fed into a Hierarchical Classification model to create groups based on similar paths. For each entry type, the model produced a dendrogram, similar to the one below for play-ins, to show which rushes were most closely matched. The tree below indicates that paths 6 and 18 are alike and very different from paths 14 and 22. I “pruned” these trees to remove outliers and reran the model as needed to produce sufficiently compact groups.
The table below provides a high-level look at the results of this grouping exercise. Carry-in rushes are restricted to successful attempts because of the caveat mentioned in the previous section but still produce the most clusters and have the highest average number of rushes per group. The lower percentage of these rushes clustered makes clear how many outliers are present, even when controlling for on-the-fly entries by only looking at possessions that go back to the defensive zone. The uncategorized carry-in rushes have significantly more observations per path than the clustered rushes, which suggests that this non-group is mostly made up of some combination of more complex and broken plays. The dumped-in and played-in data, unsurprisingly, provide fewer observations but have the advantages of including the unsuccessful attempts and capturing a higher percentage of the data.
| N | Avg. Rushes | Cluster % | |
|---|---|---|---|
| Carry-In | 7 | 22 | 64% |
| Dump-In | 3 | 31 | 93% |
| Play-In | 4 | 9 | 80% |
Results
Carry-Ins
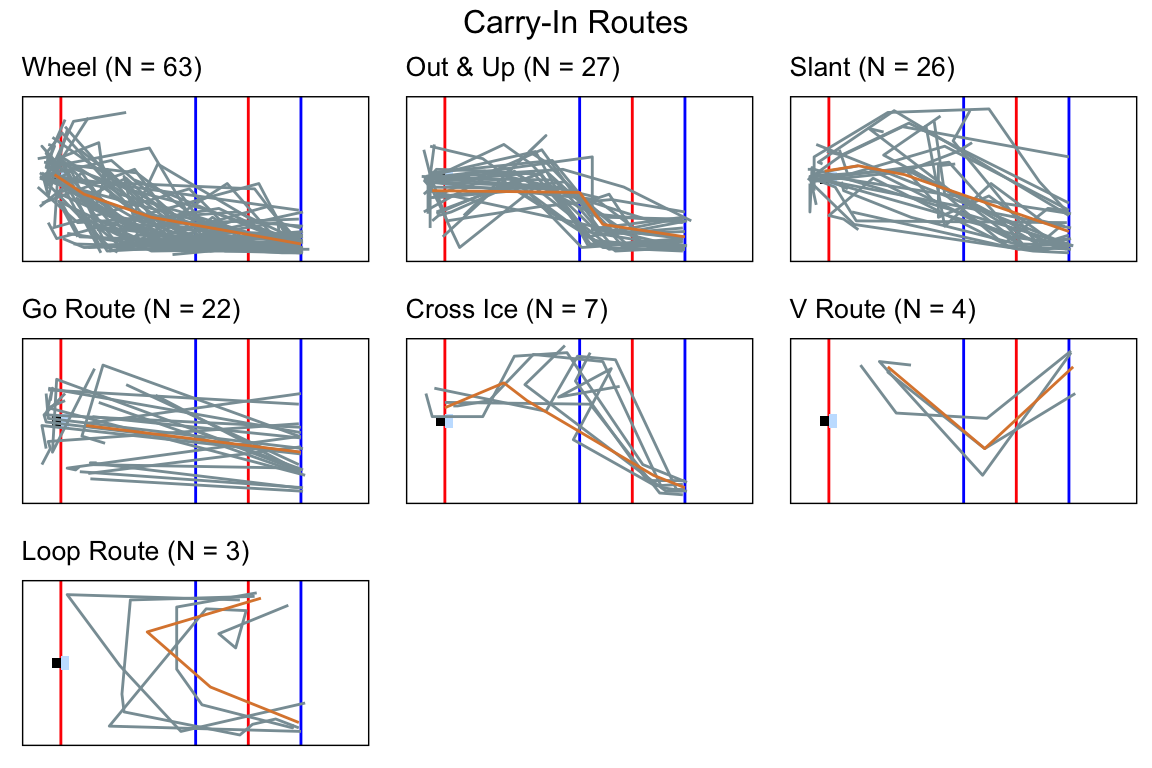
First, we take a look at the routes taken to carry the puck into the offensive zone. Presented below, each graph shows all the entry paths for a given group as a team advances from left to right towards the opponent’s blue line. The paths are flipped to be on the same side of the ice and displayed with an orange line representing a typical path. Looking at the most commonly used routes, simplicity seems to be the dominant theme. Teams commit to one side of the ice and bring the puck straight up from there. Given the fact that the defense’s aim is to collapse in front of their own goal and force their opponent to the outside, these paths seem to be influenced just as much by what is in front of them as their own plans. The remaining three routes all involve some lateral movement and their small sample sizes may be an indication that they have a lower success rate. If true, this shows the drawback of trying to challenge the defense’s structure instead of taking what is given.
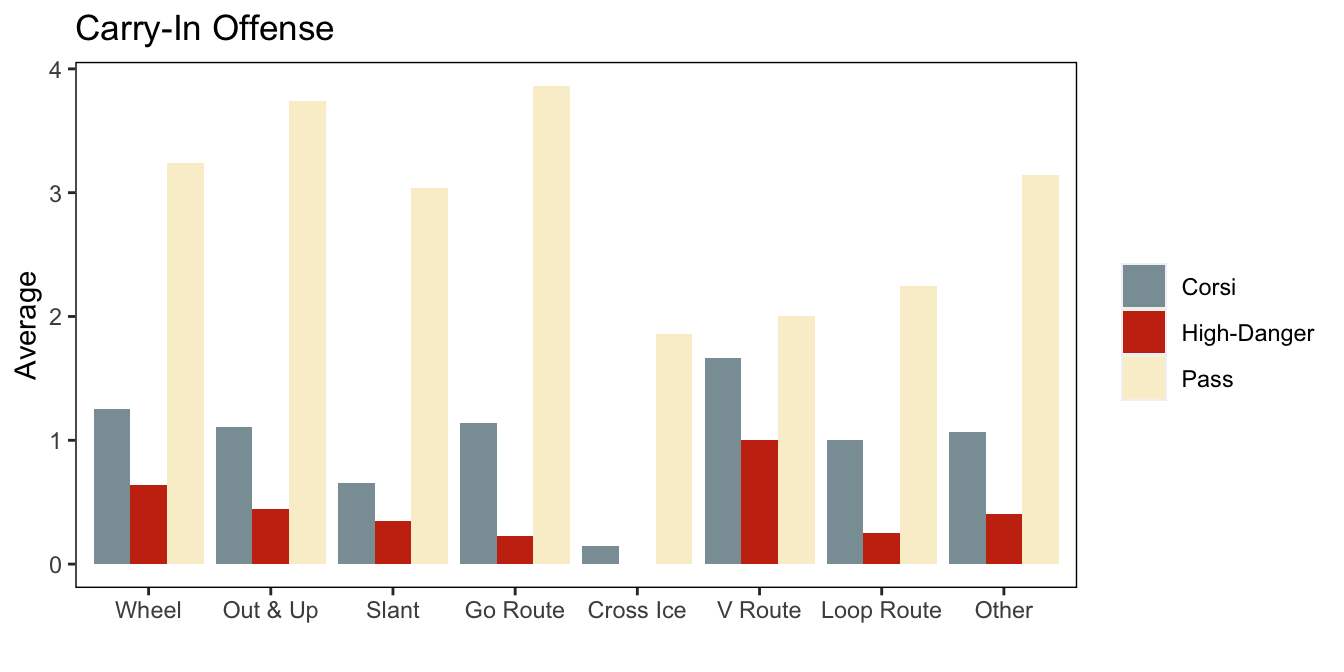
With these groups in mind, we can now look to see if they have any impact on a team’s offensive zone success. The bar chart below shows the average shot attempts, high-danger shot attempts, and successful zone passes for each cluster. For the most part, there is no significant difference for any cluster. This is especially true when only looking at the five groups with samples large enough to start inferring signals (Wheel, Out & Up, Slant, Go Route, and Other/Non-Clustered). The takeaway, then, seems to be that entry routes on carry-ins do not impact offensive production.
Dump-Ins & Play-Ins
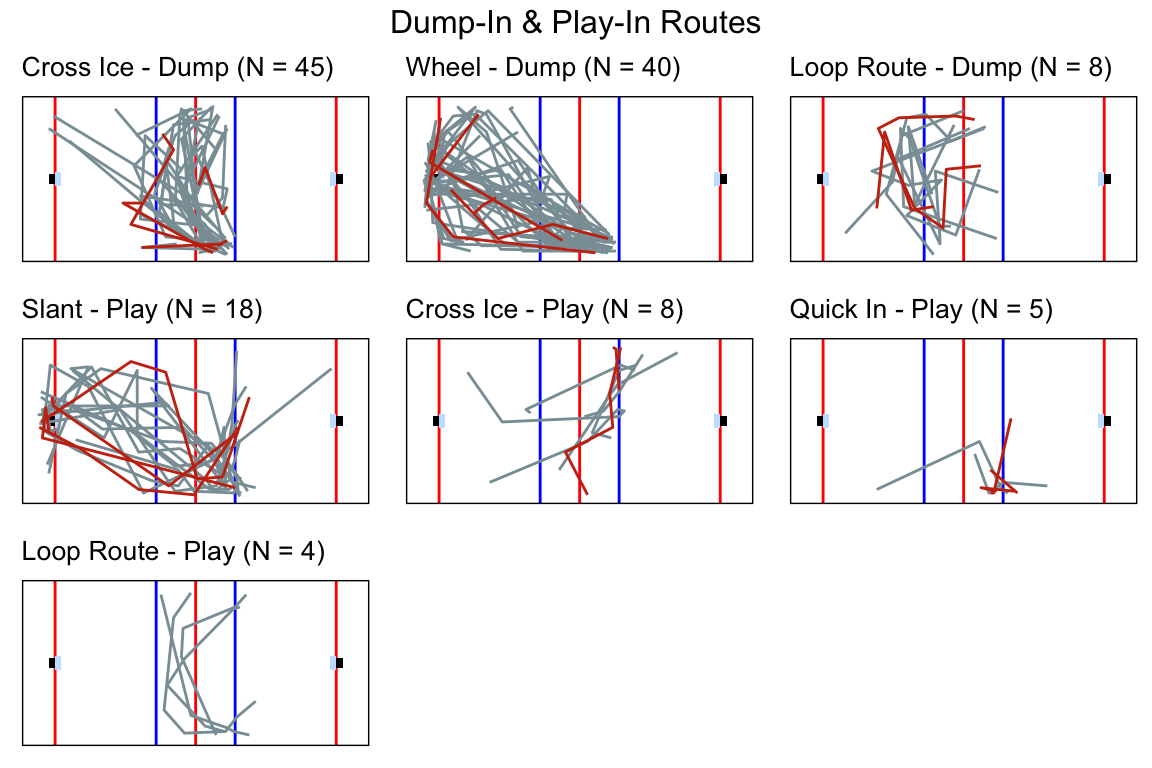
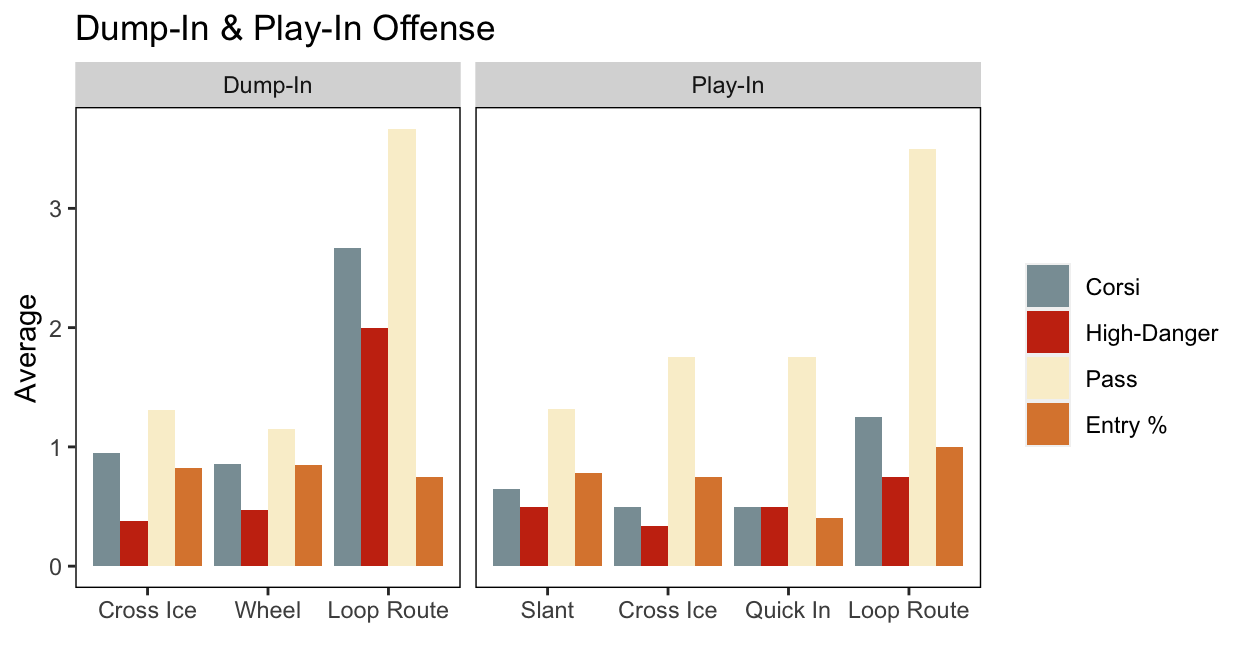
Next, we turn to the other two entry types to see if a similar pattern emerges. The plots below show the cluster routes for both dump-ins and play-ins, with the dark red lines representing unsuccessful attempts. The paths are not as tidy as the carry-ins, suggesting that some are plans gone awry, but we can see that about half of the routes for each entry type follow the same strategy of moving up one side of the ice. The rest have more lateral movement, which signals that the offense believes there is some benefit to challenging the defense’s structure.
The zone stats presented below do not seem to back up this belief however. There’s almost no difference in the entry rate between the dump-in clusters and the same is true for the two most common play-in routes, slant and cross ice. Trying to look past the noise caused by small samples, none of the groups seem to provide a significant boost to the offense’s output. Again, the takeaway is that the team’s entry route has little to no impact on what they do once they get into the offensive zone.
Conclusion
This paper set out to determine what impact, if any, the entry route taken on a powerplay has on offensive zone success. An initial split of the data by entry type revealed that teams may benefit from dumping the puck in more instead of trying to carry it in, given the difference in entry success rate. After grouping similar routes with the use of Dynamic Time Warping and Hierarchical Classification, I found that teams most often take a path away from the middle when bringing the puck up the ice, potentially as a response to the defense’s structure. Looking at the average shot attempts and zone presence of each of these clusters, no one path seems to provide a significant advantage. The key discovery is that entry routes have no impact on what a team does once they get into the zone and that they should take the path of least resistance to get there.
As with most projects, this analysis would benefit from additional data, both in the form of more games and more granular observations. More games would help to reduce the noise in the data and allow for more advanced statistical evaluation.3 More granular data would improve the precision of the route paths. The routes created here are based mostly on the locations of puck recoveries, passes, and receptions. This leaves a lot of space for unknown movements and obstacles that force a player in one direction or another. Tracking-level data would also allow for the defense to be mapped, allowing us to better understand when an attacking team is being forced into a path or going against the grain.
It may also be the case that the limited practice time before the Olympics and shortened training camp before the 2021 NWHL season prevented teams from installing more complex entry plays. Previous seasons of NWHL data would help test this hypothesis, allowing for comparisons over time.
(Photo: “File:Bostonpride2016.jpg” by Troy Parla is licensed under CC BY-SA 4.0)
Next Gen Stats: Intro to new Route Recognition Model. www.nfl.com/news/next-gen-stats-intro-to-new-route-recognition-model↩︎
Defined as one-timers and attempts within 25 feet of the front of the goal.↩︎
OLS regressions looking at the impact of route on the offensive zone stats, controlling for team, opponent, score differential, and period, provided no significant results in the carry-in dataset. The dump-in and play-in datasets were too small for a similar analysis of any consequence.↩︎
