
Blue on Blue: An analytical look at the Columbus defense
The Blue Jackets entered the 2019-2020 season with several major questions, the most pressing being whether two unproven goalies could replace the consistent, Vezina-level play of Sergei Bobrovsky. Joonas Korpisalo and Elvis Merzlikins responded by providing solid goaltending for most of the season and actually helped improve the team’s Goals Against Average from 2.82 to 2.61. None of this occurred in a vacuum however, and a large part of that improvement can be attributed to the defensive corps in front of them. And while it’s easy to see the contributions of a player like Seth Jones on tape, quantifying this for every player is much less straightforward. So, in an attempt to better connect what we see with easily available data, I decided to follow Haider Hussain’s process for grouping NBA players by role to identify the different ways defenders in the NHL play and see which Blue Jacket players contributed to their success.
| Defense | Offense | Finishing | |
|---|---|---|---|
| Offensive ZS % | 0.78 | 0.11 | -0.03 |
| Shot Attempts | 0.44 | 0.60 | 0.30 |
| Corsi For | 0.42 | 0.65 | 0.25 |
| EV % | 0.20 | -0.53 | -0.32 |
| EV Goals | 0.18 | 0.36 | 0.89 |
| Takeaways | 0.18 | 0.46 | 0.25 |
| Shooting % | 0.10 | 0.24 | 0.84 |
| EV Assists | -0.01 | 0.61 | 0.46 |
| EV TOI | -0.11 | 0.74 | 0.32 |
| Giveaways | -0.12 | 0.37 | -0.10 |
| oiShooting % | -0.12 | 0.32 | 0.52 |
| Through % | -0.14 | 0.01 | 0.56 |
| Hits | -0.15 | -0.65 | -0.16 |
| Penalty Minutes | -0.20 | -0.55 | 0.03 |
| oiSave % | -0.22 | -0.30 | -0.02 |
| Blocks | -0.69 | -0.20 | -0.24 |
| Corsi Against | -0.72 | 0.00 | -0.10 |
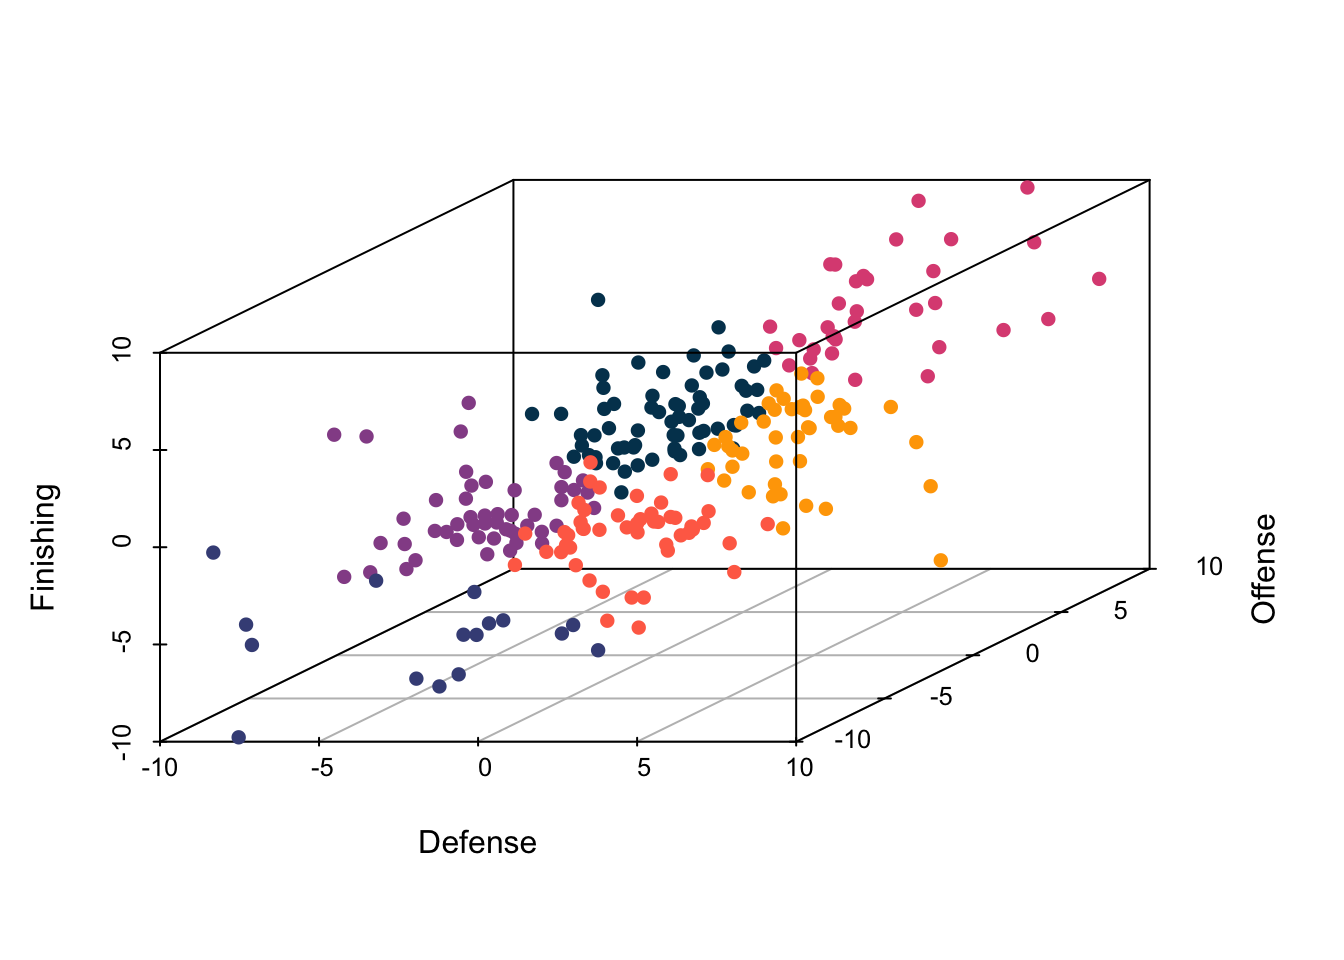
As the base for this exercise, I used player stats from Hockey Reference to create a dataset with 17 stats (converted to a per 60 minutes basis where applicable) for the 256 players with at least 120 minutes of ice time in 2019-2020. After standardizing each series with z-scores, Principal Component Analysis was applied to get three factors from the data. These weights, shown in the table above, sacrifice a large portion of the variation found in the original data but have the benefit of reducing everything to three dimensions, and broadly represent offense, defense, and finishing ability. These newly created variables, plotted below, are then used to create six groups with k-means clustering. The tables in the following section present notable players from each of these groups and general observations on what they have in common.
Norris Candidates
| Player | Team | Defense | Offense | Finishing |
|---|---|---|---|---|
| Jeff Petry | MTL | 5.56 | 6.09 | 3.14 |
| Shea Theodore | VEG | 9.43 | 8.16 | 5.73 |
| Thomas Chabot | OTT | 1.79 | 5.69 | 1.98 |
| Adam Fox | NYR | 3.33 | 5.32 | 4.79 |
| Alex Pietrangelo | STL | 4.83 | 7.06 | 6.62 |
The Norris Candidates group contains the most recognizable names and for good reason. These defenders rate out as the best in all three categories and possess the ability to not only dictate play but also put the puck in the back of the net.
Two-Way Players
| Player | Team | Defense | Offense | Finishing |
|---|---|---|---|---|
| Neal Pionk | WPG | 3.09 | 2.94 | 1.30 |
| Vince Dunn | STL | 6.81 | 1.10 | 2.28 |
| Matt Roy | LAK | 3.42 | 0.71 | -0.35 |
| Mikhail Sergachev | TBL | 2.64 | 1.69 | 2.20 |
| Rasmus Andersson | CGY | 2.17 | 0.99 | 1.52 |
This group is similar to the Norris Candidates in terms of defensive impact but lacks some of the offense and finishing skill. That said, these players still provide value at both ends of the ice.
Stay-at-Home Defenders
| Player | Team | Defense | Offense | Finishing |
|---|---|---|---|---|
| Brayden McNabb | VEG | -1.27 | -1.78 | -2.69 |
| Brenden Dillon | TOT | -0.53 | -3.84 | -2.75 |
| Henri Jokiharju | BUF | 0.82 | -2.49 | -0.70 |
| Jamie Oleksiak | DAL | 1.71 | -2.90 | -1.85 |
| Nick Jensen | WSH | 0.77 | -0.74 | -3.98 |
These players may not be as recognizable as the previous two categories but they still have a positive impact on the defensive end. They can’t be relied upon on at the other end of the ice however, as they rate out negatively on offense and finishing.
Forwards Playing Defense
| Player | Team | Defense | Offense | Finishing |
|---|---|---|---|---|
| Darnell Nurse | EDM | -1.21 | 2.41 | 1.43 |
| Ethan Bear | EDM | -0.23 | 3.14 | 1.55 |
| Alex Goligoski | ARI | -2.55 | 1.24 | -0.37 |
| Jacob Trouba | NYR | -3.31 | 1.78 | 0.53 |
| Marc-Edouard Vlasic | SJS | 0.48 | 1.65 | -0.13 |
This group is the mirror image of the Stay-at-Home Defenders, as they rank second best in terms of offense and finishing but have a negative impact in their own zone. Interestingly, a lot of players typically perceived as Norris candidates ended up listed here, as their offensive impact mask some of their deficiencies on the other side of the puck.
Bottom Pair Players
| Player | Team | Defense | Offense | Finishing |
|---|---|---|---|---|
| Chris Tanev | VAN | -5.89 | -0.07 | -0.53 |
| Esa Lindell | DAL | -3.74 | 1.18 | -0.64 |
| David Savard | CBJ | -6.05 | -2.64 | -3.94 |
| Zdeno Chara | BOS | -5.65 | -0.81 | 1.86 |
| Jack Johnson | PIT | -2.47 | -3.44 | -2.22 |
These players are rated as the worst defenders of all six groups and provide almost as much negative value in the offensive zone. There are a few surprising names on this list, which may have just as much to do with the difficulty of estimating defensive impact as their ability.
7th Defenders
| Player | Team | Defense | Offense | Finishing |
|---|---|---|---|---|
| Ilya Lyubushkin | ARI | -1.27 | -6.30 | -5.41 |
| Alex Biega | DET | -2.08 | -5.63 | -5.86 |
| Korbinian Holzer | TOT | -8.57 | -7.70 | -5.00 |
| Trevor Daley | DET | -3.49 | -3.94 | -5.00 |
| Roman Polak | DAL | -8.91 | -6.76 | -6.47 |
The smallest of the six, this group is made up of players without a lot of ice time. They have a lot of variance but generally struggle on both sides of the puck.
Blue Jackets
| Player | Group | Defense | Offense | Finishing |
|---|---|---|---|---|
| Zach Werenski | Norris Candidate | 5.50 | 6.86 | 8.35 |
| Dean Kukan | Stay-at-Home Defender | 4.50 | -1.70 | -2.50 |
| Markus Nutivaara | Two-Way Player | 3.19 | -1.35 | 0.30 |
| Andrew Peeke | Stay-at-Home Defender | 2.60 | -2.60 | -2.22 |
| Seth Jones | Forward Playing Defense | 0.66 | 3.72 | 2.20 |
| Ryan Murray | Forward Playing Defense | -1.55 | 0.70 | 0.32 |
| Scott Harrington | Stay-at-Home Defender | -1.74 | -4.78 | -3.23 |
| Vladislav Gavrikov | Forward Playing Defense | -1.75 | -0.57 | 0.54 |
| David Savard | Bottom Pair Player | -6.05 | -2.64 | -3.94 |
Now that we’ve created groups for all the defenders in the league, we can look at where the Columbus players sit among them. Overall, the group has a positive impact on defense, led by Zach Werenski and his Norris Candidate level play. Beyond him, the team had a solid rotation of young defense-first players that add little to the offensive end. It’s somewhat surprising to see that Seth Jones has almost no defensive impact, however. He’s served as the center piece of the group for the past several years and receives the most praise from the national media, shouldn’t the numbers here be similarly glowing? The answer to that question begins to show the limitations of this analytical approach. As the leader of the Blue Jacket defense, Jones has to play the most challenging minutes each evening, meaning we should expect him to allow more offense than someone in a more sheltered role. With this context, it’s easier to view his season as productive, though still slightly somewhat underwhelming by his standards. At the bottom of the table, the issues caused by not having situational context come into full view. Vladislav Gavrikov and David Savard play the traditional role of a shutdown line for Columbus and as a result, spend most of their time in the defensive end. This assignment puts them in a position to face a lot of offensive firepower, pushing their ratings negative. Even with that knowledge, it is troubling to see that Savard also adds so little to the offensive end while averaging the third most even strength minutes on the team.
Looking ahead, it seems like Columbus will continue to be a tough team to score against, with several high-end defensive players. The margins will be slimmer however, as Markus Nutivaara and Ryan Murray were moved out in the off-season. This could be offset by the continued improvement of their young players, a return to full form by Seth Jones, and better contributions from David Savard.
(Photo: “Columbus Blue Jackets v St. Louis Blues” by Mathieu Thouvenin is licensed under CC BY-NC-ND 2.0)
